Want more housing stories from Lance Lambert’s ResiClub in your inbox? Subscribe to the free, daily ResiClub newsletter.
When assessing home price momentum, ResiClub believes it’s important to monitor active listings and months of supply. If active listings start to increase rapidly as homes remain on the market for longer periods, it may indicate potential future pricing weakness. Conversely, a rapid decline in active listings could suggest a market that is heating up.
Generally speaking, housing markets where active inventory has returned to pre-pandemic levels have experienced softer home price growth (or outright price declines) over the past 24 months. Conversely, housing markets where active inventory remains far below pre-pandemic levels have, generally speaking, experienced stronger home price growth over the past 24 months.
National active listings are on the rise (up 36.6% from July 2023 to July 2024); however, we’re still well below pre-pandemic levels (July 2024 was 28.7% below July 2019).
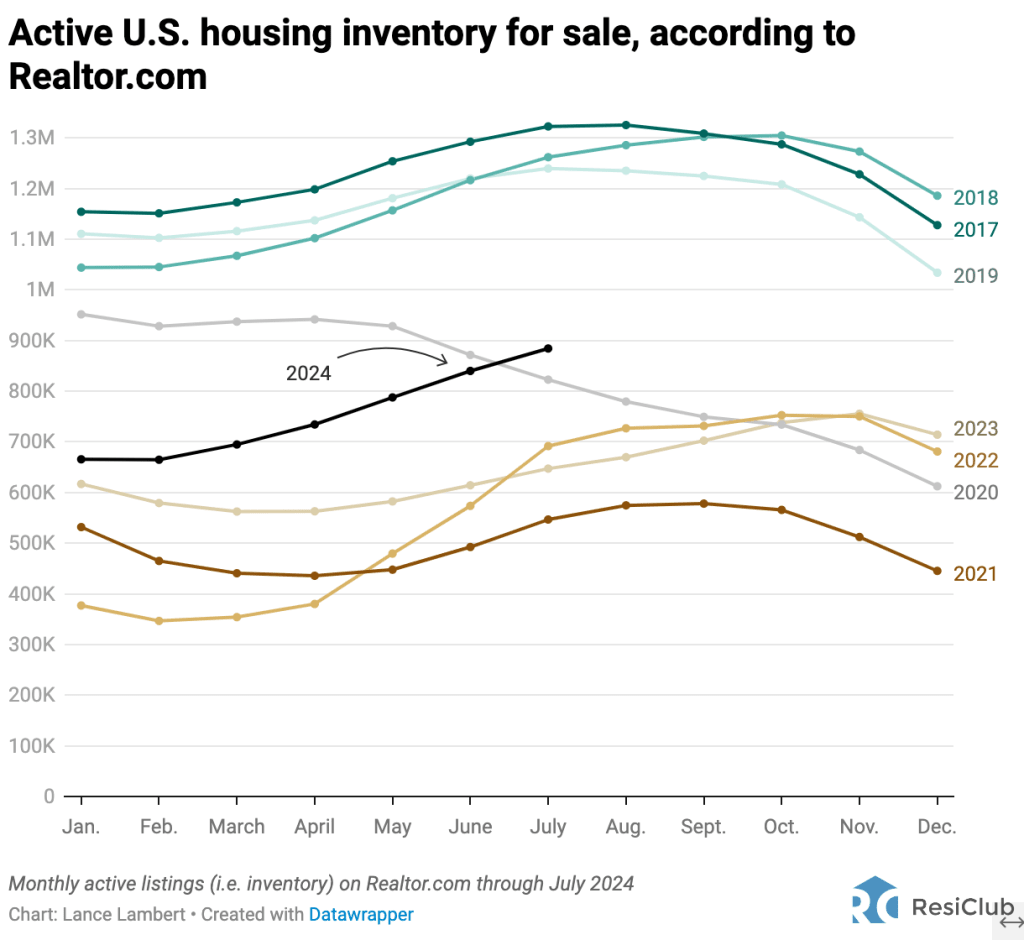
Here were the total July inventory/active listings over recent years, according to Realtor.com:
July 2017: 1,322,659
July 2018: 1,261,916
July 2019: 1,239,534
July 2020: 822,834 (overheating during the pandemic housing boom)
July 2021: 546,686 (overheating during the pandemic housing boom)
July 2022: 691,652 (mortgage rate shock starts)
July 2023: 647,135
July 2024: 884,273
The area with the biggest inventory jump? Florida.
In Florida, the biggest inventory increases initially over the past two years were concentrated in southwest sections of the state. In particular, inventory is up in markets like Cape Coral, Punta Gorda, and Fort Myers, which were hard-hit by Hurricane Ian in September 2022. This combination of increased housing supply for sale (the damaged homes) coupled with strained demand (the result of spiked home prices, spiked mortgage rates, higher insurance premiums, and higher HOA fees) translated into market softening across much of Southwest Florida.
However, the inventory increases have now expanded into markets like Jacksonville and Orlando, which are also above pre-pandemic levels, as are many coastal pockets along the state’s Atlantic Ocean side.
One reason for this is that Florida’s condo market is dealing with the aftereffects of regulation passed following the Surfside condo collapse in 2021.
Click here to view an interactive version of the map below.
Last month, three states had returned to pre-pandemic 2019 inventory levels: Texas (which first did so in May), Florida, and Idaho.
This month, Tennessee joined that group.
Not too far behind are states like Colorado, Washington, Utah, and Arizona.
Why are Sun Belt and Mountain West markets seeing a faster return to pre-pandemic inventory levels than many Midwest and Northeast markets?
One factor is that some pockets of the Sun Belt and Mountain West experienced even greater home price growth during the pandemic housing boom, which stretched fundamentals too far beyond local incomes. Once pandemic-fueled migration slowed and rates spiked, it became an issue in places like Boise and Austin.
Unlike many Sun Belt housing markets, Northeast and Midwest markets tend to have lower levels of homebuilding. As new supply becomes available in Southwest and Southeast markets, and builders use affordability adjustments like mortgage rate buydowns to move it, there’s a cooling effect in the resale market. The Northeast and Midwest don’t have that same level of new supply, so resale/existing homes are pretty much the only game in town.
Big picture: We’re observing a softening across some housing markets as strained affordability tempers the fervor of a market that was unsustainably hot during the pandemic housing boom. While home prices are falling in some areas around the Gulf, most regional markets are still seeing positive home price growth. The big question going forward is whether active inventory and months of supply will continue to rise and cause more housing markets to see outright price declines.